October 13, 2020
Since 2005, Yale has committed itself to integrating sustainable practices into the ethos and operations of the larger University. Today, as part of Sustainability Week, the Office of Sustainability is excited to launch the Yale Sustainability Data Hub, an interactive page to promote data transparency and the ongoing integration of sustainable practices across the University.
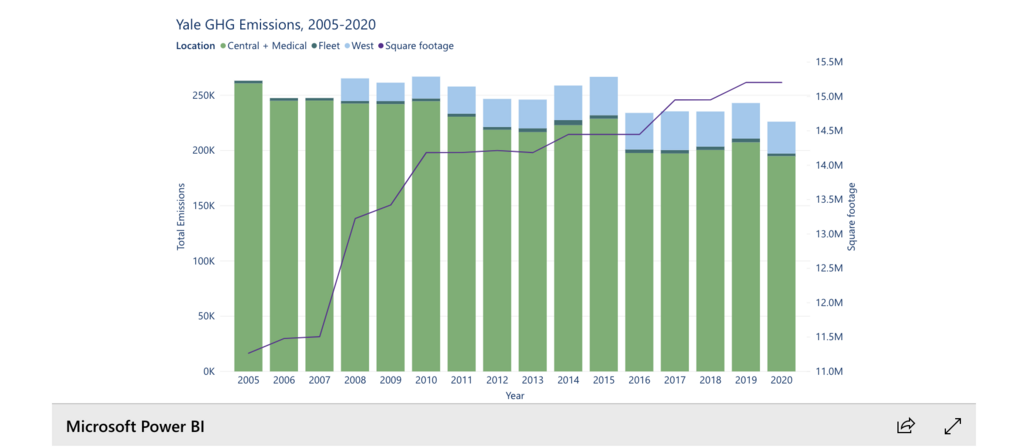
The Yale Sustainability Data Hub will be housed within the main Yale Sustainability site. From its landing page, the Data Hub will provide Yale community members and non-affiliates alike with access to up-to-date, interactive graphics related to sustainability at Yale. Currently, visualizations of greenhouse gas emissions, paper purchasing, and Zoom meetings are featured on the site, with many more in the works!
While nascent now, the Data Hub is promising because of the scope of its inquiry. Many offices across the University compile data reports each fiscal year, but this data can be difficult to find and maneuver. In contrast, the Data Hub aims to be a central repository for relevant sustainability data. This approach to data collection and presentation is key to busting the myth that integrating sustainable practices into mundane habits is daunting. For individual users, Lindsay Crum, Senior Manager of Data Analysis & Program Management at Yale Sustainability, suggests viewing the Data Hub as a “tool in our tool belt to hold a mirror to ourselves.” Compiling and visualizing University data clarifies the impact a large-scale institution has on our environment, and thus, it illuminates how integral individual efforts related to sustainability are for reaching our common sustainability goals.
The most exciting feature of the Data Hub is the interactive nature of the data itself. Crum says these graphs represent “not a stable picture, but something we want people to play with.” Furthermore, thanks to Power BI—the software used to render the graphs—the data can be easily filtered and sorted to produce the most meaningful visualizations possible for each individual user—whether you are a student looking for data for a research paper or someone just searching for fun. In this way, Data Hub turns what before was sterile, hard to interpret, and inaccessible, into something more meaningful for all Yale community members.
Yale Sustainability is looking forward to expanding and evolving the Data Hub over time to most accurately reflect University practices. Future graphics to look out for include a more detailed look at greenhouse gas emissions and campus waste (trash, recycling, compost, reuse) statistics.
Concerning any published data, Yalies can feel welcome to contact the Office of Sustainability for more information. In the meantime, as Crum says, “The data shows that people like data!” So please, take advantage of this beautiful resource to help foster a more sustainable Yale.